
Plant biodiversity is one of the key indicators of ecosystem health and productivity. It is also difficult to estimate at large scales. Forest structure has increasingly been recognized as a way to approximate patterns in the distribution of biodiversity. But how well do biodiversity-structure relationships hold up across climate zones?
“If we look at biodiversity-structure relationships across regions, we see noticeable differences between, say, Washington state and Florida. But why should that be? What is driving those disparities? By quantifying how climate differs between regions, we can start to develop a three-way relationship between climate, biodiversity and forest structure that lets us explore how climate may be mediating the relationship between the other two.”
Chris Hakkenberg
A new study by Drs. Christopher R. Hakkenberg and Scott J. Goetz, recently published in Global Ecology and Biogeography, uses lidar and field observations from the NEON program to explore how climate mediates biodiversity-structure relationships (BSRs) across the United States. Their findings could help improve biodiversity maps created with remote sensing data and better predict the impact of habitat degradation and climate change on biodiversity across disparate regions.
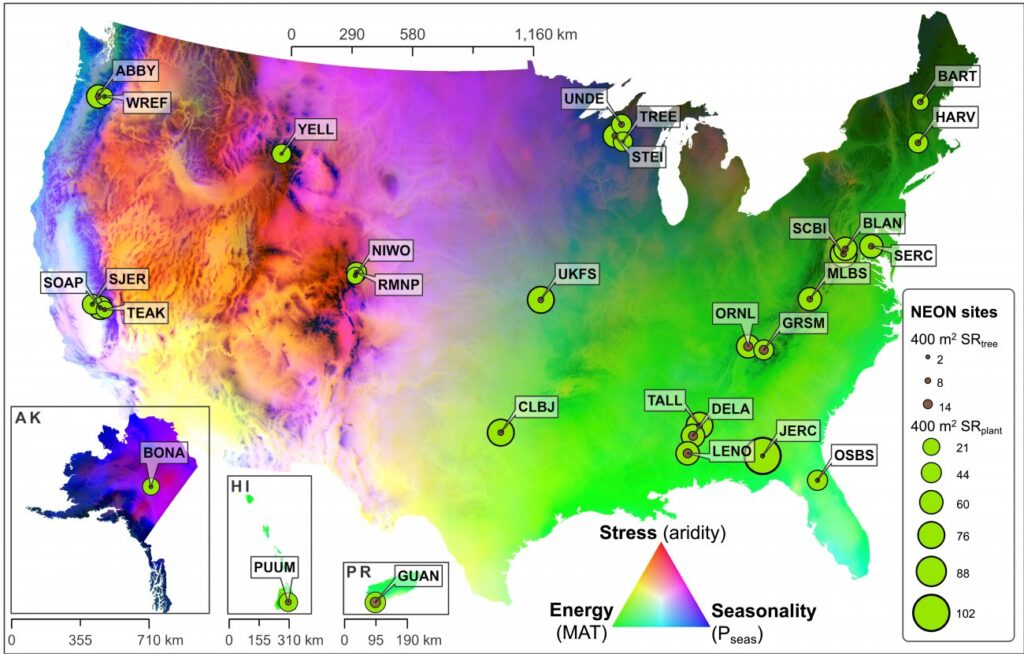
“The big takeaway here is that climatic context plays a substantial role in how forest structure relates to plant diversity”
Chris Hakkenberg
Read a full write up about Chris and Scott’s work at NEON’s website, here.